MY-ASSIGNMENTEXPERT™可以为您提供online STAT501 Linear RegressioN线性回归的代写代考和辅导服务!
这是宾夕法尼亚州立大学线性回归课程的代写成功案例。
STAT501 课程简介
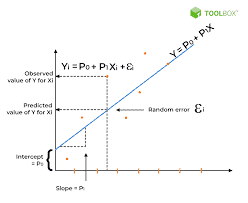
This graduate level course offers an introduction into regression analysis. A researcher is often interested in using sample data to investigate relationships, with an ultimate goal of creating a model to predict a future value for some dependent variable. The process of finding this mathematical model that best fits the data involves regression analysis.
STAT 501 is an applied linear regression course that emphasizes data analysis and interpretation. Generally, statistical regression is collection of methods for determining and using models that explain how a response variable (dependent variable) relates to one or more explanatory variables (predictor variables).
Prerequisites
This graduate level course covers the following topics:
- Understanding the context for simple linear regression.
- How to evaluate simple linear regression models
- How a simple linear regression model is used to estimate and predict likely values
- Understanding the assumptions that need to be met for a simple linear regression model to be valid
- How multiple predictors can be included into a regression model
- Understanding the assumptions that need to be met when multiple predictors are included in the regression model for the model to be valid
- How a multiple linear regression model is used to estimate and predict likely values
- Understanding how categorical predictors can be included into a regression model
- How to transform data in order to deal with problems identified in the regression model
- Strategies for building regression models
- Distinguishing between outliers and influential data points and how to deal with these
- Handling problems typically encountered in regression contexts
- Alternative methods for estimating a regression line besides using ordinary least squares
- Understanding regression models in time dependent contexts
- Understanding regression models in non-linear contexts
STAT501 Linear Regression HELP(EXAM HELP, ONLINE TUTOR)
20 points Consider two random variables $C$ and $T$ describing how many coffees and teas I will buy in the coming week; clearly neither can be smaller than 0. Based on personal experience, I know the following summary statistics about my coffee and tea buying habits: $\mathbf{E}[C]=3$ and $\operatorname{Var}[C]=1$ also $\mathbf{E}[T]=2$ and $\operatorname{Var}[T]=5$.
(a) Use Markov’s Inequality to upper bound the probability I buy 4 or more coffees, and the same for teas: $\operatorname{Pr}[C \geq 4]$ and $\operatorname{Pr}[T \geq 4]$.
(b) Use Chebyshev’s Inequality to upper bound the probability I buy 4 or more coffees, and the same for teas: $\operatorname{Pr}[C \geq 4]$ and $\operatorname{Pr}[T \geq 4]$.
30 points Consider a parked self-driving car that returns $n$ iid estimates to the distance of a tree. We will model these $n$ estimates as a set of $n$ scalar random variables $X_1, X_2, \ldots, X_n$ taken iid from an unknown pdf $f$, which we assume models the true distance plus unbiased noise. (The sensor can take many iid estimates in rapid fire fashion.) The sensor is programmed to only return values between 0 and 20 feet, and that the variance of the sensing noise is 64 feet squared. Let $\bar{X}=\frac{1}{n} \sum_{i=1}^n X_i$. We want to understand as a function of $n$ how close $\bar{X}$ is to $\mu$, which is the true distance to the car.
(a) Use Chebyshev’s Inequality to determine a value $n$ so that $\operatorname{Pr}[|\bar{X}-\mu| \geq 1] \leq 0.5$.
(b) Use Chebyshev’s Inequality to determine a value $n$ so that $\operatorname{Pr}[|\bar{X}-\mu| \geq 0.1] \leq 0.1$.
(c) Use the Chernoff-Hoeffding bound to determine a value $n$ so that $\operatorname{Pr}[|\bar{X}-\mu| \geq 1] \leq 0.5$.
(d) Use the Chernoff-Hoeffding bound to determine a value $n$ so that $\operatorname{Pr}[|\bar{X}-\mu| \geq 0.1] \leq 0.1$.
30 points Consider the following 3 matrices:
$$
A=\left[\begin{array}{ccc}
1 & -2 & 3 \
-2 & 3 & 4
\end{array}\right] \quad B=\left[\begin{array}{ccc}
3 & 5 & 2 \
-1 & 2 & -3 \
4 & 3 & 5
\end{array}\right] \quad C=\left[\begin{array}{ccc}
2 & 1 & 6 \
-1 & 7 & 2 \
3 & 3 & -2
\end{array}\right]
$$
Report the following:
(a) $A B$
(b) $B+C$
(c) Which matrices are full rank?
(d) $|C|_F$
(e) $|B|_2$
(f) $C^{-1}$
20 points Consider the following 3 vectors in $\mathbb{R}^9$ :
$$
\begin{aligned}
v & =(1,2,4,5,-1,2,4,2,1) \
u & =(-2,3,-4,3,1,-3,-2,3,6) \
w & =(3,1,4,-3,-7,-2,2,3,1)
\end{aligned}
$$
Report the following:
(a) $\langle v, w\rangle$
(b) Are any pair of vectors orthogonal, and if so which ones?
(c) $|u|_2$
(d) $|w|_{\infty}$
0 points Consider a pdf $f$ so that a random variable $X \sim f$ has expected value $\mathbf{E}[X]=3$ and variance $\operatorname{Var}[X]=10$. Now consider $n=10$ iid random variables $X_1, X_2, \ldots, X_{10}$ drawn from $f$. Let $\bar{X}=\frac{1}{10} \sum_{i=1}^{10} X_i$
(a) What is $\mathbf{E}[\bar{X}]$ ?
(b) What is $\operatorname{Var}[\bar{X}]$ ?
(c) What is the standard deviation of $\bar{X}$ ?
(d) Which is larger $\operatorname{Pr}[X>4]$ or $\operatorname{Pr}[\bar{X}>4]$ ?
(e) Which is larger $\operatorname{Pr}[X>2]$ or $\operatorname{Pr}[\bar{X}>2]$ ?

MY-ASSIGNMENTEXPERT™可以为您提供ONLINE STAT501 LINEAR REGRESSION线性回归的代写代考和辅导服务!